
India’s small and marginal farmer:
Where they live and What they produce. India’s small and marginal farmer:
Shweta Saini and Aneek Chowdhury
Brief: As per India’s Agriculture Census 2015-16, 86.1 percent of Indian farmers are small and marginal (SMF) i.e., have a landholding size smaller than 2 hectares. More than half of these live in five Indian states of Uttar Pradesh, Bihar, Madhya Pradesh, Maharashtra and Andhra Pradesh (Agriculture Census 2015-16). And most of them cultivate the classic combination of cereals i.e., paddy in kharif (and even in rabi in some cases) and wheat in rabi. Cotton is the third most preferred crop, followed by maize and gram (NSO 2018-19).
About the Arcus Blog series
Researchers at Arcus Policy Research dwell into data extraction and interpretation from various GOI sources. Recently the team has been working on the NSSO 77th Round Survey titled “Survey on Land and Livestock Holding of Households and Situation Assessment of Agricultural Households in 2018-19”. This blog series is based on the team’s ongoing learnings about Indian agriculture from the survey data. To strengthen discourse about Indian agriculture, we hope to draw awareness to many facets of Indian agriculture through these blogs.
For questions and feedback write to us on admin@arcusresearch.in.
Suggested Citation: Saini and Chowdhury (2023). India’s small and marginal farmers: Where they live and What they produce. Arcus Blog Series # 1.
Key Words: fragmentation of land, small farmers, marginal farmers, cropping pattern, SAS 2018-19
1970 – 71 – 70. And. 2015 – 146 – 86.
These are important statistics on Indian agricultural landholdings. But what do they mean?
In simple words, they say that in 1970, India had about 71 million operational landholdings and 70 percent of them were small and marginal (Agriculture Census). By 2015-16, these numbers increased to about 146 million and 86 percent respectively.
So, where does this 86 percent of India’s small and marginal farmer live? And what do they produce? Using results from national representative surveys, we present answers to these two basic questions. We start by defining the farmer categories.
Who is a small and marginal farmer (SMF) in India?
As per India’s Agriculture Census, operational holdings of farmers are divided into five land-size classes:
- Landholdings which are less than 1.0 hectares (which comprises of two sub-categories, below 0.5 hectares and greater than 0.5 but less than 1.0 hectares), referred to as marginal landholdings;
- Landholdings sizes higher than 1.0 but lower than 2.0 hectares, referred to as small landholdings;
Together, (i) and (ii) i.e., landholdings with size below 2 hectares are referred to as the small and marginal landholdings. About 86 percent of India’s landholdings belong in this range.
- Landholdings which are more than 2.0 but less than 4.0 hectares (comprises of two sub-categories: more than 2.0 but less than 3.0 hectares, and between 3.0 and 4.0 hectares);
- Landholdings which are more than 4.0 but less than 10.0 hectares (comprises of three sub-categories, more than 4.0 to less than 5.0 hectares, more than 5.0 to less than 7.5 hectares, and more than 7.5 to less than 10 hectares);
Landholdings with size between 2 and 10 hectares are collectively referred to as the medium sized landholdings. About 13.2 percent of India’s landholdings belong in this category.
- Landholdings which are more than 10.0 hectares (this too has two sub categories: more than 10 but less than 20 hectares, and greater than 20 hectares). This is the large landholding-size category. Less than 1 percent (0.6 percent) of India’s landholdings belong in this category.
A few points on the Census data on landholdings:
- In the absence of any farmer-level Census data, this data on landholdings is loosely interpreted to represent farmers. The general statement about 86 percent of India’s farmers being small and marginal comes from this data on landholdings. This generalization does have its problems, however, generally the usage is accepted by all academics and policy makers alike;
- This data does not include an assessment of agricultural labourers (ones who do not own land or have any legal right to operate on land but he/she works on land owned by others in return of wages paid to them in cash or kind) and landless farmers;
- Operational land differs from owned land: The Agriculture Census captures data on operational holdings which is a much wider concept than owned landholdings. For example, if as per revenue records the land is one holding, but in practice the land is cultivated independently by say 3 persons without any dispute, then even without a legal partition, Agriculture Census will count these as three operational holdings.
Trends in Indian SMF’s Landholdings
India’s Agricultural Census is available for 10 years: 1970-71, 1976-77, 1980-81, 1985-86, 1990-91, 1995-96, 2001-02, 2005-06, 2010-11, and 2015-16. It appears from data in these Census that overtime:
- The number of India’s landholdings has been growing: from about 71 million in 1970-71 to 146 million in 2015-16;
- The landholding sizes have been shrinking: from 2.3 hectares in 1970-71 to 1.1 hectares in 2015-16; and
- Close to half of India’s agricultural land is with India’s SMF: About 47.3 percent of operational land is with India’s small and marginal: this was about 21 percent in 1970-71.
Figure 1: Indian Agricultural Operational Holdings: (a) Number in Million, (b) Operated Area (million hectares) and (c) Average landholding sizes (hectares)
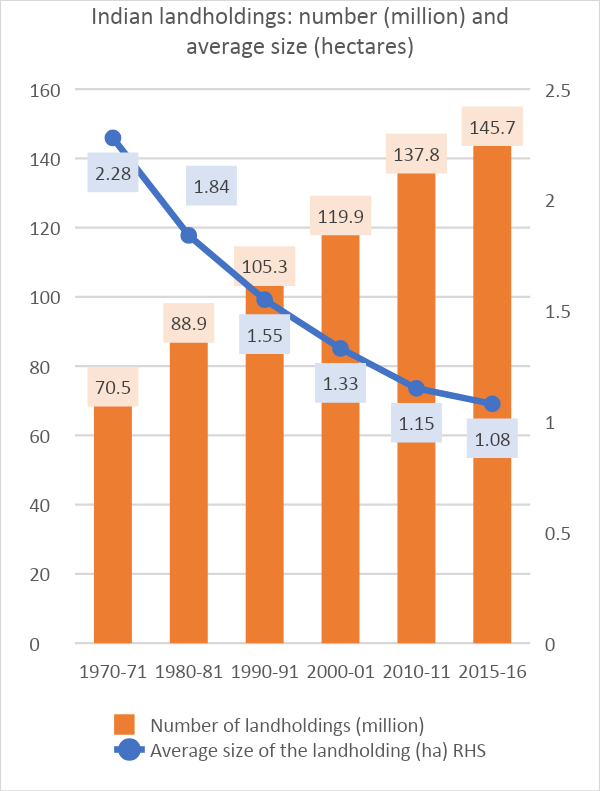
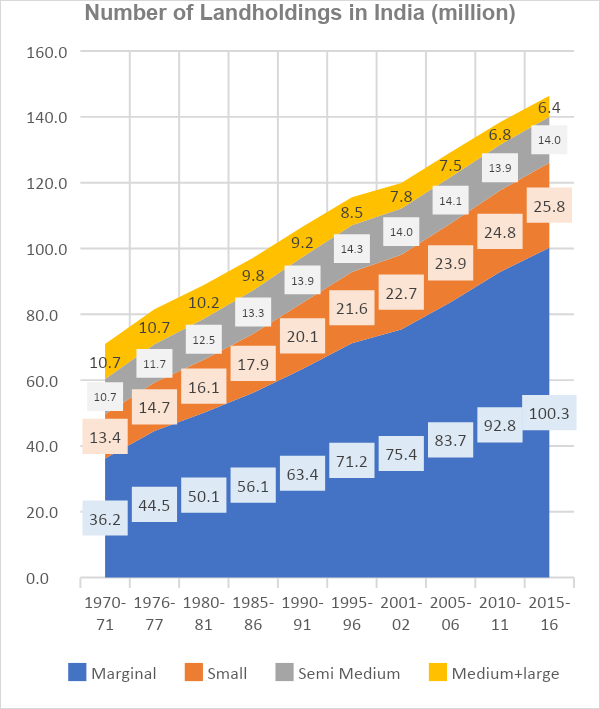
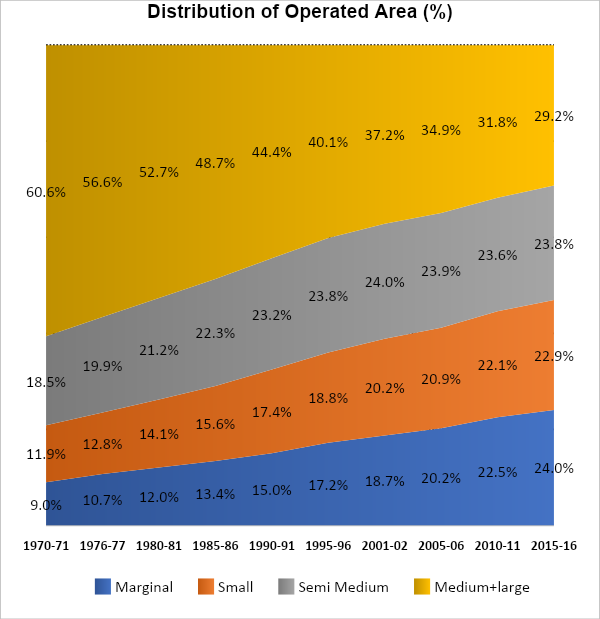
Source: Agriculture Census, Various Year
Where does India’s SMF live?
About 50 percent of India’s SMF lives in five states: Uttar Pradesh (18 percent), Bihar (13 percent), Maharashtra (10 percent), and Madhya Pradesh and Andhra Pradesh (each with 6 percent) (Agriculture Census 2015-16). The darker the green color in Figure 1, higher is the concentration of India’s SMF in the state. India’s northern and north eastern states either have larger landholdings and/or have lower number of Indian farmers.
Figure 1 State-wise distribution of Small and Marginal farmers (2015-16)
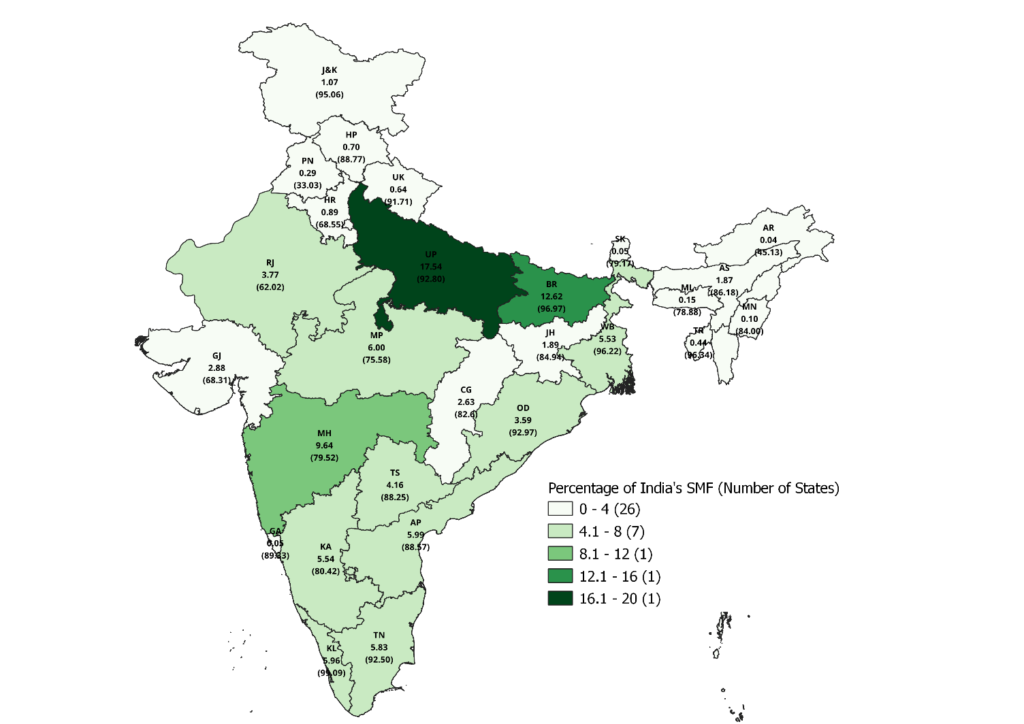
Source: Agriculture Census 2015-16
Note: The number in the map’s parenthesis is the share of SMF in the state’s total farmer. The number in the legend’s parenthesis denotes the number of states and UTs. UP is Uttar Pradesh, BR is Bihar, MH is Maharashtra, MP is Madhya Pradesh, AP is Andhra Pradesh, KL is Kerala, TN is Tamil Nadu, KA is Karnataka, WB is West Bengal, TS is Telangana, RJ is Rajasthan, OD is Odisha, GJ is Gujarat, CH is Chhattisgarh, JH is Jharkhand, J&K is Jammu & Kashmir, HR is Haryana, HP is Himachal Pradesh, UK is Uttarakhand, PN is Punjab, GA is Goa. North eastern states include AS is Assam, AR is Arunachal Pradesh, TR is Tripura, ML is Meghalaya, MZ is Mizoram, NL is Nagaland, SK is Sikkim and MN is Manipur.
Against the name of each state, the graph gives in parenthesis the percentage of SMF within each state’s total landholdings. The SMF constitute more than 90 percent of the landholdings in 10 states/UTs including Kerala, Bihar, West Bengal, J&K, Odisha, UP, Tamil Nadu and even Uttarakhand. Nagaland, Punjab and Arunachal Pradesh have the least share of SMF in their total landholdings.
What do these Indian SMF grow?
For this analysis, we use the NSSO’s SAS 2018-19 dataset.
Using the unit-level data from National Sample Survey’s (NSS) 77th round of Survey on Land and Livestock Holding of Households and Situation Assessment of Agricultural Households in 2018-19 (SAS 2018-19), we can infer the cropping pattern of Indian farmers. The SAS data can help us identify the main crops sown by farmers in both the kharif and the rabi seasons. For both the seasons, we identified the top crops that are sown by these small farmers and sold in the market for generating a value. The crops which are sown solely for self-consumption and not sold in the market are not covered in this analysis. Details about the method are given in Annexure 2. We find that across Indian states, most SMF preferred cultivating cereals in both kharif and rabi seasons. While paddy dominated in both kharif (all India) and rabi (in southern and eastern states), wheat was the preferred rabi crop in the northern states. Gram (chana), maize and cotton followed close next choices of Indian SMF.
We list a few interesting observations from this data below:
- Paddy is the major kharif crop for most of the Indian states. In rabi season while most north Indian states cultivate wheat, the eastern and north Eastern states still prefer to grow paddy.
- Fruits are not favored by SMF: Barring SMF in Himachal, and J&K who grew apples and those in Kerala who cultivated bananas, SMF at large did not prefer to undertake the costly cultivation of fruits;
- Vegetables: Not many SMF preferred commercial cultivation of vegetables. SMF in north-eastern states of Nagaland, Manipur, Mizoram emerged to have preference for leafy vegetable cultivation. Otherwise, it was green peas and beans in Himachal, cauliflower and spinach in Punjab, potato in Uttarakhand, West Bengal and UP, or brinjal in Odisha.
- Maize emerged as top three crops in both rabi and kharif seasons. In Bihar, Karnataka and Telangana, maize emerged as a preferred crop of SMF in both kharif and rabi seasons. In J&K, Punjab, Himachal, Rajasthan and Chhattisgarh, the crop was sown in kharif.
- Sugarcane is the most profitable crop and only SMF in Uttarakhand and UP reported cultivating cane throughout the year;
- Fibers: SMF in the peninsular states of Andhra and Telangana reported cultivating cotton in both kharif and rabi seasons. SMF in Maharashtra, Gujarat, Odisha and Haryana reported sowing the crop in kharif season. Other than cotton, in both rabi and kharif seasons Kerala and Tripura’s SMFs have reported the cultivation of rubber crop. While SMFs of West Bengal and Jharkhand showed an identical cropping pattern, where the SMFs are cultivating jute in the kharif season.
- Among the oilseeds:
- Maharashtra, Rajasthan and MP SMF preferred soybean in kharif;
- Mustard is preferred outside the southern peninsula and so its production preference was high in MP, Rajasthan, Gujarat, West Bengal, Jharkhand among others.
- Castorseed: Gujarat’s SMF preferred castorseed. Groundnut did not emerge to be their top choices;
- Groundnut: SMF in southern states of Tamil Nadu and Andhra cultivated groundnuts.
- Among the Pulses’ group:
- None states in the northern areas (barring Uttarakhand) or even southern peninsula (barring Andhra) emerged to choose pulses in its top three crops;
- Gram was preferred by SMF in Rajasthan, MP, Maharashtra, and Chhattisgarh;
- Tur was top choice for SMF only in Maharashtra;
- Moong (green gram) was preferred in Odisha;
- Urad (black gram): SMF in MP and Andhra reported sowing the urad pulse
- Millets: Only jowar and bajra emerged in top three crops. These millets were preferred by SMF in Karnataka (jowar) and bajra in UP, Rajasthan and Haryana; and
- Fodder crops were sold in Punjab, J&K, and Haryana.
Figure 2: Top three crops cultivated by India’s small and marginal farmers in year 2018-19
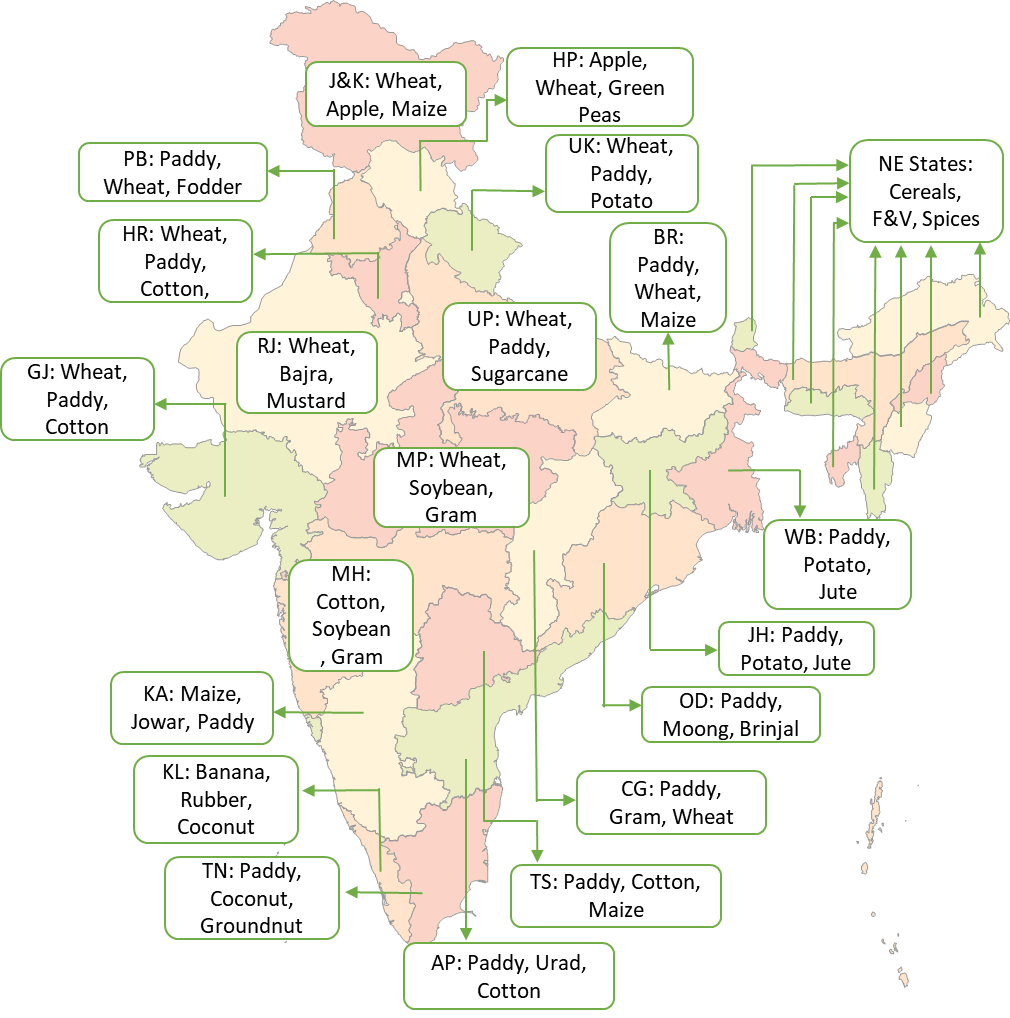
Source: NSS 77th round SAS 2018-19.
Note: the state initials are same as given in Figure 1.
In a nutshell, majority of Indian SMF were found to be dependent on rice and wheat cropping patterns. But where do these SMF sell their crops? Do all get to sell under the GOI’s MSP regime or do they sell in the open market? We explore that in our next discussion paper.
Bibliography
(2019). Agriculture Census 2015-16. Link
(2020). All India Report on Agriculture Census 2015-16. New Delhi: (Agriculture Census Division) Department of Agriculture. Link
Sharma, V. P. (2016). Marketable and Marketed Surplus of Rice and Wheat in India: Distribution and Determinants. Indian Journal of Agricultural Economics Vol.71, No.2, April-June, 137-159. Link
NSS 77th Round SAS Report (2021). Situation Assessment of Agricultural Households and Land and Livestock Holding of Households in Rural India, 2019. Government of India; National Statistical Office. Link
Annexure 1: Top three crops cultivated by SMF in different states and percentage of SMF cultivating that particular crop.
| States | Visit 1 – Kharif | Visit 2 – Rabi | ||||
| India | Paddy (42.39%) | Cotton (6.63%) | Maize (6.08%) | Wheat (32.2%) | Paddy (13.15%) | Gram (4.72%) |
| Uttar Pradesh | Paddy (46.68%) | Sugarcane (16.94%) | Bajra (14.3%) | Wheat (64.27%) | Sugarcane (12.72%) | Potato (4.68%) |
| Bihar | Paddy (89.33%) | Maize (3.53%) | – | Wheat (63.79%) | Maize (16.93%) | Masur (5.06%) |
| Maharashtra | Cotton (24.21%) | Soybean (18.46%) | Paddy (15.83%) | Gram (18.11%) | Tur (11.42%) | Wheat (8.74%) |
| Madhya Pradesh | Soybean (35.05%) | Paddy (14.89%) | Urad (12.8%) | Wheat (60.52%) | Gram (20.2%) | Mustard (6.71%) |
| Andhra Pradesh | Paddy (53.15%) | Cotton (9.59%) | Groundnut (6.28%) | Paddy (32.04%) | Urad (11.27%) | Cotton (6.66%) |
| Kerala | Banana (18.02%) | Rubber (17.11%) | Coconut (15.88%) | Rubber (16.82%) | Coconut (13.93%) | Banana (13.68%) |
| Tamil Nadu | Paddy (28.25%) | Coconut (11.73%) | Groundnut (8.3%) | Paddy (42.96%) | Coconut (13.02%) | Groundnut (11.01%) |
| Karnataka | Maize (15.51%) | Paddy (12.85%) | Jowar (9.31%) | Jowar (12.91%) | Maize (12.51%) | Paddy (12.42%) |
| West Bengal | Paddy (69.86%) | Jute (8.28%) | Other Vegetables (2.37%) | Paddy (42.23%) | Potato (14.8%) | Mustard (5.03%) |
| Telangana | Paddy (47.48%) | Cotton (31.93%) | Maize (5.65%) | Paddy (60.59%) | Cotton (15.09%) | Maize (6.73%) |
| Rajasthan | Bajra (32.14%) | Soyabean (18.05%) | Maize (9.57%) | Wheat (49.05%) | Mustard (22.32%) | Gram (11.95%) |
| Odisha | Paddy (73.84%) | Cotton (3.4%) | Brinjal (2.92%) | Paddy (21.84%) | Moong (14.64%) | Brinjal (9.24%) |
| Gujarat | Paddy (26.71%) | Cotton (25.02%) | Castorseed (8.67%) | Wheat (36.81%) | Mustard (9.46%) | Castorseed (8.71%) |
| Chhattisgarh | Paddy (96.52%) | Maize (1.63%) | Mustard (0.53%) | Paddy (35.37%) | Gram (27.89%) | Wheat (10.34%) |
| Jharkhand | Paddy (70.23%) | Jute (8.67%) | Other Vegetables (2.48%) | Paddy (42.79%) | Potato (14.83%) | Mustard (5.54%) |
| Assam | Paddy (55.82%) | Betel Nut (6.39%) | Other Vegetables (3%) | Paddy (36.44%) | Potato (9.21%) | Brinjal (6.94%) |
| Jammu & Kashmir | Apple (30.88%) | Maize (24.62%) | Paddy (12.93%) | Wheat (80.72%) | Mustard (7.23%) | Other Fodder Crops (7.12%) |
| Haryana | Paddy (42.47%) | Cotton (25.83%) | Bajra (19.2%) | Wheat (74.35%) | Mustard (13.09%) | Other Fodder Crops (4.41%) |
| Himachal Pradesh | Apple (25.31%) | Maize (16.78%) | Green Peas (11.67%) | Wheat (22.67%) | Green Pea (21.79%) | Green Beans (9.15%) |
| Uttarakhand | Paddy (22.9%) | Sugarcane (9.08%) | Other Pulses (8.79%) | Wheat (38.24%) | Potato (10.57%) | Sugarcane (8.7%) |
| Tripura | Paddy (61.66%) | Rubber (14.61%) | Brinjal (3.63%) | Paddy (40.32%) | Rubber (16.94%) | Brinjal (6.61%) |
| Punjab | Paddy (84.92%) | Maize (4.2%) | Caulifower (1.97%) | Wheat (77.5%) | Other Fodder Crops (17.84%) | Spinach (1.32%) |
| Meghalaya | Paddy (20.66%) | Ginger (13.27%) | Betel Nuts (10.57%) | Potato (14.62%) | Other Leafy Vegetables (13.78%) | Paddy (11.71%) |
| Manipur | Paddy (55.2%) | Cabbage (9.3%) | Other Vegetables (7.6%) | Cabbage (22.48%) | Other Vegetables (21.47%) | Other Leafy Vegetables (14.44%) |
| Mizoram | Other Leafy Vegetables (16.33%) | Paddy (12.14%) | Green Chilies (8.96%) | Other Leafy Vegetables (29.03%) | Brinjal (11.58%) | Green Chilies (11.37%) |
| Goa | Paddy (52.38%) | Nigerseed (22.53%) | Coconut (8.54%) | Cashewnuts (54.53%) | Chilies (24.19%) | Coconut (10.32%) |
| Sikkim | Paddy (23.48%) | Cardamom (15.41%) | Ginger (13.67%) | Maize (12.19%) | Cabbage (10.26%) | Cauliflower (9.73%) |
| Arunachal Pradesh | Paddy (46.26%) | Maize (12.41%) | Other Vegetables (9.37%) | Paddy (16.88%) | Maize (14.36%) | Other Vegetables (8.58%) |
| Nagaland | Yam (15.21%) | Potato (13.39%) | Paddy (11.52%) | Other Leafy Vegetables (17.74%) | Cabbage (8.77%) | Beans (7.94%) |
Source: NSS 77th round SAS 2018-19. Note: “-“represents no crops being cultivated by majority of SMF. The number in parenthesis is the percentage of SMF cultivating that particular crop.
Annexure 2: Method of identifying SMF’s major crops
In the questionnaire for the SAS 2018-19, a farming household can report maximum of four crops sown by them in the year. For identifying the crops – farmers are divided into five major operational land-holding classes in the SAS 2018-19 data set. Secondly, a cross-tabulation is produced by considering the five categories and the crops that are grown by them for selling in the market. As SMFs across the states are growing multiple crops in one season, the top three crops cultivated by most of the SMFs are considered for our study. In Figure 2 the top three crops across two visits (kharif and rabi) are depicted in different states.