
Which Indian farmers benefit from GOI’s MSP operations?
Findings from NSSO’s SAS 2018-19
Abstract
Using the unit-level data from NSSO’s 77th round SAS 2018-19, we estimate the proportion of farmers who sold their crops at minimum support price (MSP) and thus benefitted under Government of India’s procurement operations. As per SAS 2018-19, there were about 9.3 crore farmers in India in 2018-19. Out of these, close to 9 per cent reported selling at MSP. Out of these MSP-beneficiaries, 75 per cent were small and marginal farmers (SMF). Of the total value generated by all farmers from selling at MSP, about 42 per cent was from SMFs. Three crops emerged to dominate MSP operations: paddy, wheat, and, to some extent, cotton. Geographically, most MSP beneficiaries lived in Chhattisgarh, Uttar Pradesh, Madhya Pradesh, and Telangana. MSP beneficiaries in Punjab, and Haryana though were smaller in number but generated the highest per capita value from the MSP operations.
Despite its existence of close to 58 years, the MSP regime emerges to have benefitted less than 10 percent of Indian farmers. To provide income support to farmers, is MSP (a price support tool) the right way? Or is the MSP tool today pleading innovation in its vision or design?
Keywords: MSP, small farmers, marginal farmers, rice, wheat, Punjab, Chhattisgarh, SAS 2018-19
Suggested Citation: Saini and Chowdhury (2023). Which Indian farmers benefit from GOI’s MSP operations? Arcus Blog Series # 2
About the Arcus Blog Series
The research team at Arcus Policy Research dwells into data extraction, analysis, and interpretation from various GOI sources. Recently the team has been working on the NSSO 77th Round Survey titled “Survey on Land and Livestock Holding of Households and Situation Assessment of Agricultural Households in 2018-19”. The current blog series is based on the team’s ongoing learnings about Indian agriculture from the survey data. To strengthen discourse about Indian agriculture, we hope to draw awareness on many facets of Indian agriculture through these blogs. This is the second blog in the series. The first can be read here.
For questions and feedback write to us on admin@arcusresearch.in
Which Indian farmers benefit from GOI’s MSP operations?
Findings from NSSO’s SAS 2018-19
Shweta Saini and Aneek Chowdhury
Government of India (GOI) supports Indian farmers largely via three ways: it subsidizes inputs; provides output price support and gives an unconditional cash transfer to its landowning farmers. In this blog, we focus on the output price support mechanism of GOI and assess the number of people who benefit from it.
India’s MSP Operations
Via its minimum support price (MSP) operations, GOI provides output price support to 23 Indian crops (DFPD 2022). These crops are:
- Seven Cereals: Paddy, Wheat, Maize, Jowar, Bajra, Ragi, and Barley (together represent about 99 per cent of Indian cereal production)
- Five Pulses: Gram, Tur, Urad, Moong, and Masur (together represent about 91 per cent of Indian pulses’ production)
- Eight Oilseeds: Groundnut, Seasmum, Mustard and Rapeseed/Toria, Coconut, Sunflower seed, Safflower, Soybean, Nigerseed (together represent about 95 per cent of Indian oilseed production); and
- Three Cash Crops: Cotton, Jute, and Sugarcane.
MSP of a crop is recommended annually by the Ministry of Agriculture and Farmer Welfare’s Commission for Agricultural Costs and Prices (CACP) and is later passed by the Parliament. Ideally, they are declared before the farmer makes her sowing decisions. So, for the kharif crops (sowing starts around June), CACP publishes the price report by March of that year and for rabi (sowing starts around October), the MSPs are declared by July/August.
CACP’s recommendation of a crop’s MSP is based on qualitative and quantitative assessment of the crop’s return to its growers, its global and domestic situation, cultivation costs, and domestic and international price trends, among other things.
The scale of GOI’s procurement operations in a year are guided, among other things, by two objectives: (i) the need to provide price support to a harvested crop, which is the primary objective; and (ii) for meeting grain needs to feed GOI’s food-based welfare programs. The latter applies to crops directly linked with GOI programs like the National Food Security Act (NFSA), and mid-day meal scheme for school children. The annual demand for these programs influences the level of procurement that the country must undertake in a year.
The first objective of providing price support, though applies to all 23 crops, is effectively more instrumental in crops like cotton, sugarcane, oilseeds, and even pulses (apart from rice and wheat). While cotton and sugarcane are regularly procured, pulses and oilseeds are procured based on specific demands placed by state governments. In years of bumper crops, when prices fall during harvest months, state governments request for GOI’s MSP intervention.
Most of GOI’s expenditure on output price support is aligned with its need for feeding the food-based welfare programmes, where it procures a fixed quantity of the crop each year, transports, stores, and distributes it to identified beneficiaries (PIB 2022). Even though these operations provide support to farmers, their expenditures are categorized under ‘food subsidy’ and counted under consumer support programs. For oilseeds and pulses (and even copra), the output price support expenditures are with Ministry of Agriculture under schemes like the PM-Aasha, and MIS-PSS.
In all these MSP crops, GOI or its designated agencies or state agencies, undertake physical procurement of the crop, and most of the beneficiary farmers get a digital transfer of their dues directly into their bank account within the span of 15 days. In some states, intermediaries also get involved in the procurement operations.
Sugarcane is an interesting case. Even though GOI declares its MSP or as it is called the “fair and remunerative price (FRP)”, it does not procure it directly. It gets the sugar mills to buy the cane from farmers at FRP. Unlike another crop’s MSP, FRP is more legally binding as it is effectively a statutory price below which no sugar mills can buy cane. In case of other crops purchased at MSP, the crops can be sold in the open market at any prices above or below MSP and only the produce offered for sale and procured by government fetches farmer the MSP. As GOI mandates the mills to pay FRP to its cane farmers, it has had to trigger a spate of interventions to support financial viability of these mills. Covering these interventions is beyond the purview of the current work. Interested readers may like to read here.
As per the Food Corporation of India (FCI), GOI’s nodal agency under MSP, government commits to procuring any available quantity of the MSP crop (of acceptable quality) that is offered to them for sale. However, in practice, GOI sets state-wise procurement targets every season (PIB 2022). Besides, not all farmers benefit from the MSP system (as you will read in this blog) due to, inter alia, lack of infrastructural support, low awareness about the prevailing MSPs, and smaller pockets of produce (due to small landholding sizes) (OECD 2018).
MSP of crops in recent years has been fixed to deliver a return of at least 50 per cent to its farmers (PIB 2022). Also, as MSP assures sale and payment, farmers prefer to sell to GOI at the MSP wherever possible, unless, of course, the difference between MSP and open market prices is high.
In addition to the 23 crops, GOI also provides output price support to horticulture crops like onions and potatoes. These are essential crops for Indian consumers whose prices witness huge intra- and inter-year volatility. To smoothen the price volatility, GOI’s agencies like the National Agricultural Cooperative Marketing Federation of India (NAFED) maintain buffer stocks of these crops. NAFED procures when prices are low, offering support to farmers and later offloads in the open market to diffuse any building price pressures, offering succour to consumers.
The current blog focuses on GOI’s MSP operations, and thus, the focus is on the 23 listed crops, including sugarcane. Even though cane is not procured physically by the government, its FRP provides assured remunerative returns to cane farmers, qualifying them to be studied under the current work.
Using unit-level data from NSS’s 77th round survey titled “Situation Assessment of Agricultural Households and Land and Livestock of Households in Rural India, 2019”, we estimate the following:
- How many and which farmers benefit from GOI’s MSP operations?
- If there is a geographic concentration of MSP benefits? and
- Of the 23 crops, which crops dominate MSP operations?
The NSSO SAS (2018-19) has two separate visits to collect the farmer responses. The reference period for Visit 1 was July to December (2018), which covered mainly the kharif crops and for Visit 2 it was January to June 2018, which covered the summer and the rabi crops. Using the methodology from the SAS report, estimates from the two visits are combined to arrive at an annual estimate. The
Annexure contains the definition of terminologies used in the blog. We present our key findings below.
- How many farmers benefit under GOI’s MSP regime?
As per SAS 2018-19, the country had about 9.3 crore agricultural households or farmers in 2018-19. Among these, more than 88 per cent were small and marginal (SMF) (i.e., with an average landholding size below 2 hectares). Out of the total farmers, about 91 per cent (or about 8.5 crore) reported cultivating at least one of the 23 MSP crops. Within the SMF group, this share was marginally higher at about 92 per cent (Table 1).
Table 1: Farmers selling crops at MSP
| Type of farmers | No. of Farmers (crores) | Farmers growing any MSP crop as % of total farmers | Farmers who sold any crop at MSP as % of total farmers | Farmers who sold any crop at MSP as % of farmers growing any MSP crop |
| Farmers (All) | 9.3 | 90.9% | 8.8% | 9.7% |
| SMF Only | 8.2 | 91.7% | 7.5% | 8.2% |
Source: SAS 2018-19
Of the total farmers, 8.8 per cent reported selling their crops at MSP. Close to 74.9 percent of these were small and marginal farmers. Of the farmers who cultivated any MSP crop, close to 9.7 per cent reported selling at MSP (Table 1).
From within the SMF group, about 7.5 per cent sold at MSP. Within the SMF who cultivated any MSP crop, this share was about 8.2 per cent.
Between the two cropping seasons, more farmers in kharif (Visit 1) sold at MSP than during rabi (Visit 2).
- Where do these MSP beneficiaries live?
During the kharif season or Visit 1, 6.3 per cent of all farmers benefitted from MSP operations. A quarter of them (25.3 per cent) were from Chhattisgarh. Another quarter lived in Uttar Pradesh (14.8 per cent) and Madhya Pradesh (11.9 per cent). The twin states of Punjab and Haryana were home to only about 3.9 and 2.8 per cent of these MSP-beneficiary farmers.
Of the SMFs who benefitted from MSP in Visit 1, more than half lived in three states of Chhattisgarh (27.1 per cent), Uttar Pradesh (16.5 per cent) and Telangana (10.5 per cent). Punjab and Haryana’s share was less than 3 per cent each.
In Visit 2, (rabi season), 4.6 per cent benefitted from MSP, and more than half of them lived in three states: Uttar Pradesh (24.5 per cent), Madhya Pradesh (17.7 per cent), and Telangana (13 per cent). About 8 per cent each were in Haryana and Punjab.
Using the state-specific data of these MSP beneficiaries (Figure 1), it emerges that among farmers who grew any MSP crop, most farmers in Telangana, Chhattisgarh, Punjab and Haryana (darker coloured states in Error! Reference source not found.) benefitted from GOI’s procurement operations. States with the lightest shade are ones where most of the MSP-crop-growing farmers were bereft of procurement benefits.
Figure 1: State-wise Percentage of Farmers who benefitted under MSP (as percent of farmers who grew any MSP crop in the state): Visit 1 (left) and Visit 2 (right)
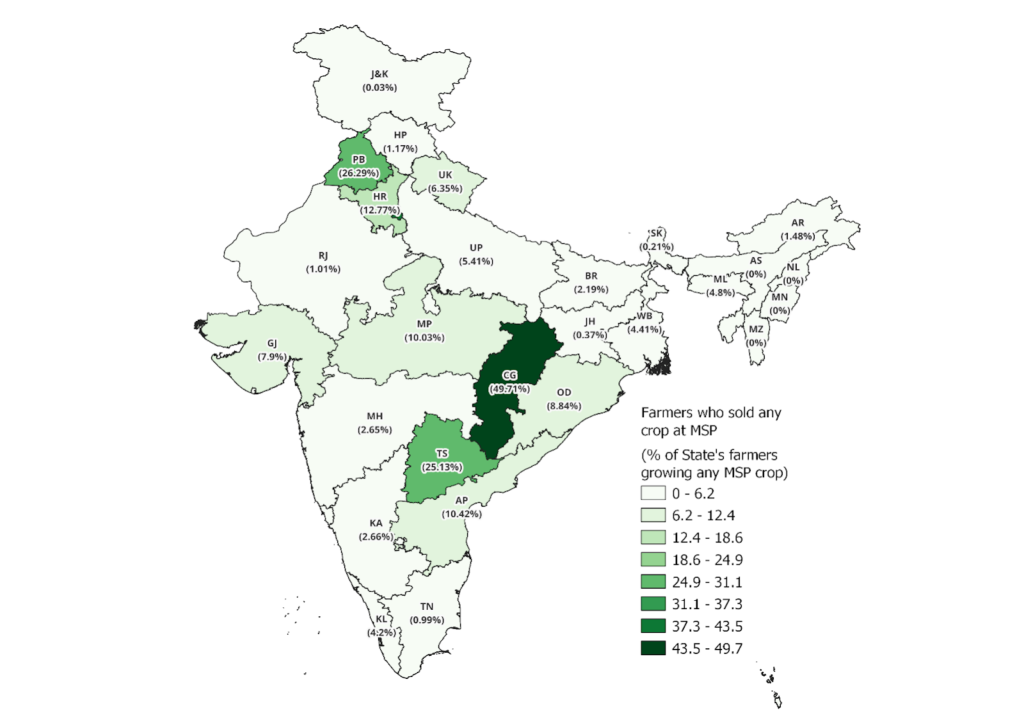
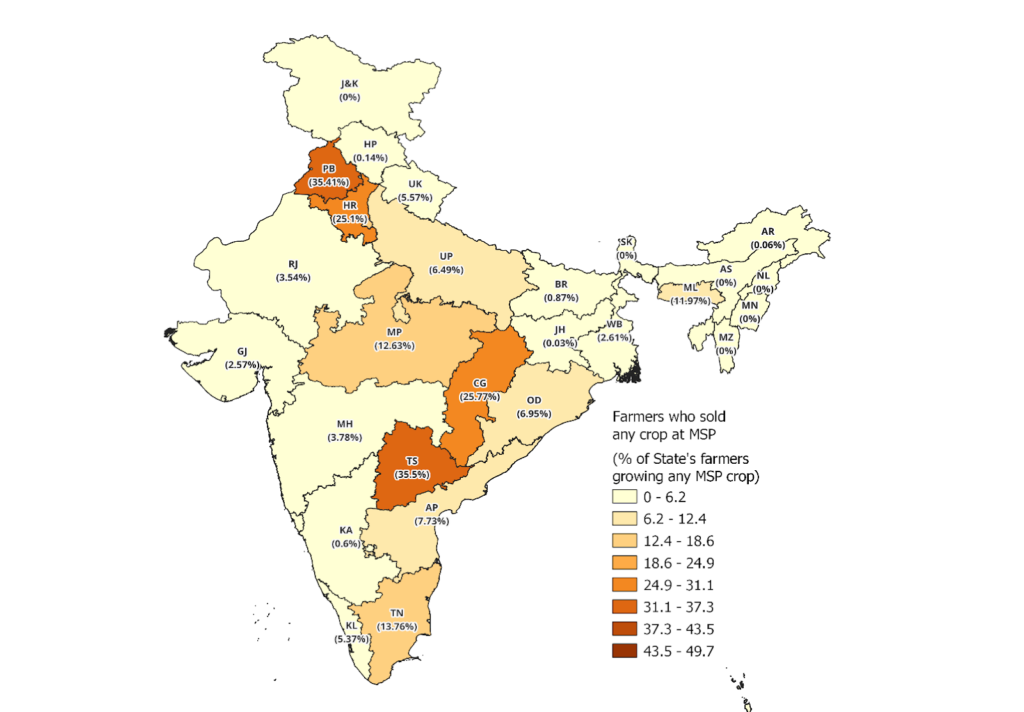
Source: Estimated by authors using SAS 2018-19 data | Note: The number in parenthesis is the share of farmers who sold at MSP as a percentage of farmers reported to grow any MSP crop. | Note: | UP is Uttar Pradesh, BR is Bihar, MH is Maharashtra, MP is Madhya Pradesh, AP is Andhra Pradesh, KL is Kerala, TN is Tamil Nadu, KA is Karnataka, WB is West Bengal, TS is Telangana, RJ is Rajasthan, OD is Odisha, GJ is Gujarat, CG is Chhattisgarh, JH is Jharkhand, J&K is Jammu & Kashmir, HR is Haryana, HP is Himachal Pradesh, UK is Uttarakhand, PB is Punjab, GA is Goa. North-eastern states include, AR is Arunachal Pradesh, TR is Tripura, ML is Meghalaya, and SK is Sikkim.
- Sate-wise Average Value Earned by Selling at MSP
In terms of the total value generated by the MSP-beneficiary farmers, we found that:
- By selling any crop in 2018-19, farmers generated a total value of about Rs. 5.3 lakh crores. Out of this, about Rs. 81,235 crores, or about 15.4 per cent was generated by farmers by selling their produce at MSP.
- Of Rs. 81,235 crores, about 42 percent was generated by SMF.
Using the estimate of the total value generated from MSP operations in a state and dividing it with the total number of MSP beneficiaries in that state, we estimate the state-wise per capita (farmer) value generated from the MSP operations (Figure 2).
Figure 2: Average Monthly Per Capita (farmer) MSP Value Earned by Farmers
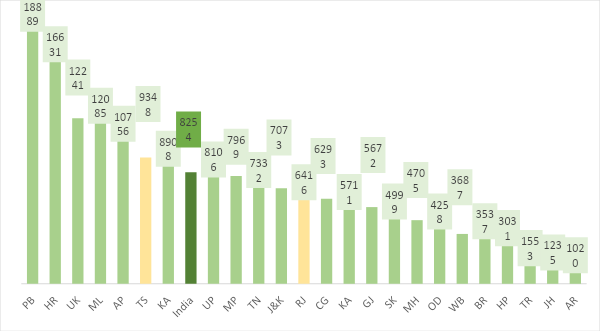
Source: Computed by Authors using data from SAS 2018-19.
We need to remember that less than 10 per cent of the Indian farmers (Table 1) benefit from Indian MSP operations, and for these 10 per cent, we find, inter alia, the following from Figure 2:
- An average Indian MSP beneficiary earned about Rs. 8,254 per month from the MSP operations. This translates to about Rs. 99,000 per year.
- On average, Punjab and Haryana farmers earned the highest average value from the MSP operations. In a month, they earned on average about Rs.19,000 in Punjab and about Rs. 16,600 in Haryana. This value was about Rs. 3500 in Bihar and about Rs. 1200 in Jharkhand.
- An average MSP-beneficiary from Telangana made less than half of Punjab’s; in case of Chhattisgarh, this value was about 1/3rd.
Even though the number of MSP beneficiaries in Punjab and Haryana were not as many as in the states of Telangana and Chhattisgarh (Figure 1), the value generated by each of them, on average, was much higher than other Indian states (Figure 2). This implies, that a lesser number of beneficiaries in Punjab and Haryana, for example, earned a larger value under MSP, perceptibly indicating to their large landholding sizes and huge marketable surpluses.
- Which crops benefitted under MSP?
We estimated the dominant crops sold at MSP using a ranking method. The crops were ranked based on the percentage of farmers reporting selling them at MSP (
Figure 3). The higher a crop’s rank, the more farmers reported selling it under MSP operations.
Figure 3: State-wise top three crops sold under MSP
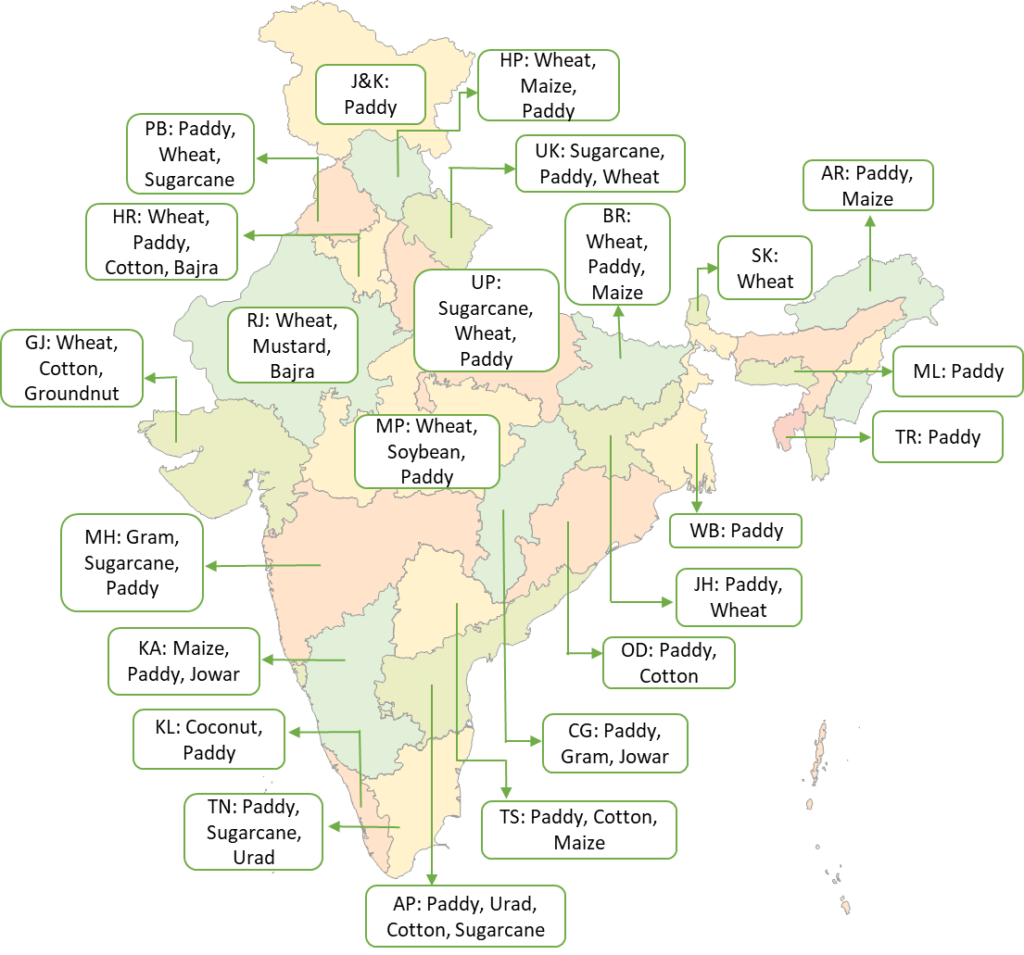
Source: SAS 2018-19 | Note: The crops listed with the state’s name are in the order of their ranks. For example, the crop mentioned first is the topmost crop reported to have been sold by most MSP beneficiary farmers in the state. Assam, Mizoram, Manipur, and Nagaland have not reported any crop sold at MSP, thus excluded from the map.
The following observations emerge from
Figure 3:
- Paddy or wheat emerged to be top crop in almost all states.
- A combination of wheat and paddy emerged in the top three in eight states: Uttar Pradesh, Bihar, Madhya Pradesh, Haryana, Punjab, Uttarakhand, Himachal Pradesh, and Jharkhand.
- Paddy was the leading crop in Punjab, J&K, Arunachal Pradesh, Meghalaya, Tripura, West Bengal, Jharkhand, Odisha, Chhattisgarh, Andhra Pradesh, Telangana, and Tamil Nadu.
- Maize emerged as the most sold crop under MSP in Karnataka. It also ranked high in Bihar, Himachal Pradesh, Arunachal Pradesh, and Telangana.
- Sugarcane was topmost in Uttar Pradesh and Uttarakhand. It was ranked high in Punjab, Tamil Nadu, Maharashtra, and Andhra Pradesh.
- Among the oilseeds, mustard most-sold MSP crop in Rajasthan. Oilseeds like soybean, groundnut, and coconut emerged as top crops in Madhya Pradesh, Gujarat, and Kerala, respectively.
- Among millets, bajra was among the top crops in Haryana and Rajasthan, and jowar in Karnataka and Chhattisgarh.
- Within pulses, gram was sold the most under MSP in Maharashtra. It was second highest in Chhattisgarh. Urad emerged in top three in Tamil Nadu and Andhra Pradesh.
- Cotton emerged in top three in Haryana, Gujarat, Odisha, Telangana, and Andhra Pradesh.
Aggregating at the national level, paddy, wheat, sugarcane, and cotton (in this order) were the top crops that benefitted from GOI’s MSP operations.
Within the top three crops at India-level, SMF’s contribution is noteworthy. Out of the total quantity of paddy sold at MSP by all farmers, 47 per cent was sold by SMFs. In case of wheat, this share was about 27 per cent and in sugarcane it was nearly 50 per cent (Figure 4). In terms of value too, these shares were similar.
Figure 4: Quantity sold at MSP by SMF and Non-SMF Farmers

Source: SAS 2018-19
- What changed for paddy and wheat MSP beneficiaries between 2012-13 to 2018-19?
As per estimates from the SAS 2012-13, about 6 per cent each of paddy and wheat farmers benefitted from MSP operations of GOI (Gupta, Khera & Narayanan 2021). Our estimates (Table 2) suggest that in comparison to 2012-13, in 2018-19:
- More farmers were cultivating paddy and wheat: It appears, the government’s drive for crop diversification to other than paddy and wheat is not yielding desired results.
- More farmers marketed their paddy and wheat crops: In 2012-13, only about 37 per cent of farmers who cultivated wheat sold the crop in the market. By 2018-19, this share exceeded 50 per cent. Same was the case of paddy. This may be attributed to inter alia, greater marketing opportunities or higher yields of the crops resulting in greater marketable surpluses.
- Of the farmers who sold the crop, more paddy farmers sold at MSP overtime. In case of wheat, this share fell.
Table 2: Farmers selling paddy and wheat at MSP in India: 2012-13 and 2018-19
| Metric | SAS 2012-13 | SAS 2018-19 | ||
| Paddy | Wheat | Paddy | Wheat | |
| Number of cultivating farmers (as % of total farmers) | 52% | 39% | 54% | 41% |
| Number of farmers who sold the crop in the market (as % of those who cultivated) | 45% | 37% | 55% | 51% |
| Number of farmers who sold at MSP (as % of farmers who sold the crop) | 13% | 16% | 15% | 10% |
| Number of farmers who sold at MSP (as % of those who cultivated) | 6% | 6% | 8% | 5% |
Source: SAS 2012-13 and SAS 2018-19| Note: SAS 2018-19 numbers are estimated by merging visit 1 and visit two without dropping the uncommon households across the two visits.
- Conclusion
Overall, less than 10 per cent of the Indian farmers appear to have benefitted under GOI’s procurement operations in 2018-19. Among the beneficiaries, 75 per cent were small and marginal farmers. In terms of the value generated under MSP operations, about 42 percent reached SMF. Chhattisgarh, Telangana, Uttar Pradesh, Madhya Pradesh, Punjab, and Haryana farmers benefitted the most from the MSP operations. Roughly 25 per cent of the MSP-beneficiaries were medium and large farmers, but in terms of the value, their contribution was about 58 per cent.
Output price support via MSP is one of the most celebrated and vital GOI programs for supporting farmers. However, with such low coverage of farmers and high geographic and crop concentration, the analysis alludes to following considerations:
- Encourage geographic diversification of GOI’s procurement operations. It has already been done by diversifying to states such as Chhattisgarh, Telangana, and Madhya Pradesh. However, key rice and wheat producing states of Uttar Pradesh and Bihar still lag.
- Procurement crops may be diversified: Climate change, evolving nutritional requirements, environmental and financial sustainability of farmers, among other things, require GOI to reconsider its open-ended rice, wheat, and sugarcane procurement drives. Can large-scale procurement of pulses, oilseeds and nutri-cereals be considered? But there are problems with the physical handling of grains by GOI and its agencies. Despite running the PDS since the 1940s, rice and wheat continue to wilt along the chain, albeit in small amounts, get lost during its transportation, and there is leakage between the grain release and purchase stages (FCI 2015). By expanding GOI’s physical procurement operations to more crops, that require specific handling and processing, additional fiscal and physical limitations are likely.
- Future of MSP is closely linked to the future of India’s National Food Security Act 2013 (NFSA) due to the legal commitment to annually supply about 65 MMTs of free rice and wheat to about 81.3 crore beneficiaries. If some states opt to give cash in lieu of grains (allowed under the NFSA), then GOI’s procurement targets can also moderate by that measure. Besides, linking procurement from a state with their respective NFSA requirements can also yield benefits of diversifying the procurement states.
- Provide access to marketing avenues and market intelligence to farmers- Nothing replaces the need for improving a farmer’s access to lucrative markets and opportunities of arbitrage. But what marketing channels have been able to deliver higher returns to farmers in the past? We will explore that in our next blog.
Points of Caution
During the analysis of the SAS 2018-19, we found several discrepancies in the survey data. While we intend to do a standalone piece on these discrepancies, we highlight one that has a direct bearing on the analysis and results in this Blog.
MSP reported by farmers (who sold at MSP), is not the same for all farmers of a commodity. For example, lets look at paddy. In 2018-19, MSP paddy was Rs. 1750 per quintal (CACP). Under SAS 2018-19, farmers who reported selling paddy at MSP, reported an MSP rate of anywhere between Rs. 1000 to Rs. 5600 per quintal. This difference in MSP rates reported by different farmers can be observed across all the listed 23 commodities. Despite these differences, SAS treats them to have been sold at MSP. We think this price difference may be explained, inter alia, by farmer’s lack of awareness about the prevailing MSP rates or due to the inherent difference in the crop qualities not captured in detail in survey responses or it could simply be associated with the costs of intermediation where farmer’s realized price is lower than the MSP, or it could just as well be reporting errors in recording the survey responses.
Annexure: Key definitions
- Agricultural Household: According to NSS, an agricultural household (farmers) is one that has at least one member who has been self-employed in agriculture for the past 365 days in either the principal status or the subsidiary status and receives more than Rs. 4000 as the value of produce from agricultural activities (such as the cultivation of field crops, horticultural crops, fodder crops, plantations, animal husbandry, poultry, fishery, piggery, beekeeping, vermiculture, sericulture, etc.). In this study, only farmers are considered. We use farmers and agricultural households interchangeably.
- Farmers who grew at least one MSP crop – from SAS 2018-19, those farmers are considered who have cultivated at least one of the 23 crops listed under MSP. This has been estimated by combining both visits 1 and 2.
- Farmers who sold crops at MSP – estimated by combining Visit 1 and Visit 2, the count of farmers reported no-zero quantity sold in any of the 23 crops listed under MSP is considered.
- Top three crops benefitting under MSP: They have been selected based on the highest number of farmers reported to have sold under MSP across the two visits. For example, if in a state in Visit 1 out of 10 farmers who grew any MSP crop, 70 per cent reported selling paddy, 60 per cent reported selling cotton, and 5 per cent maize, and in Visit 2, say out of 11 farmers who grew any MSP crop, 80 per cent reported selling wheat, 71 reported soybeans. Then, wheat, soybean, and paddy are the top three crops for that state.
- Value generated under MSP: It is calculated by multiplying the quantity and price of a crop sold at MSP reported by farmers in the data set.
Bibliography
CACP (2023). MSP. Link
FCI (2015). Report of the High-Level Committee on Reorienting the Role and Restructuring of Food Corporation of India. Link
Gupta, P., Khera, R., & Narayanan, S. (2021). Minimum Support Prices in India: Distilling the Facts. Review of Agrarian Studies vol. 11, no. 1.
Kumar, R., Chauhan, V., & Sharma, K. (2018). Minimum Support Price for Agricultural Produce. Link
NSS 77th Round 2018-19, Land and Livestock Holding of Household and Situation Assessment of Agricultural Household. Link
NSS. (2021). Land and Livestock Holdings of Household and Situation Assessment of Agricultural Household Report 2019. NSS 77th Round.
PIB. (2022). Ministry of Consumer Affairs, Food and Public Distribution. Link